25 Mobile App KPIs and Metrics You NEED to Track

Creating a mobile is a big accomplishment. But your job isn’t over once the app launches.
How is your mobile app performance doing? Are you getting the most out of your app? What’s the average user costing you? How many users are profitable?
The only way to answer these questions is by tracking mobile app metrics and KPIs. Key performance indicators will paint a clear picture of what you’re doing right and what needs improvement.
Regardless of your app type or industry, everyone should be tracking the KPIs below. We’ll cover mobile app marketing KPIs to mobile app performance metrics and everything in between. This will help mobile app marketers and mobile app developers alike improve app performance and increase user engagement.
1. App Downloads
Downloads are one of the most important mobile app KPIs to keep an eye on. It’s one of the easiest ways to tell if your mobile app marketing efforts are working or not.
If your app isn’t getting downloads, then there are likely other issues with your marketing funnel.
For those of you who weren’t marketing your app prior to launch, you can’t expect a huge number of downloads on day one. So you need to set realistic expectations for this metric and try not to compare your download metrics to Facebook or Twitter.
It’s important to track your downloads over time and see how this app metric trends in correlation to your marketing efforts. This can help you pinpoint which marketing campaigns are driving downloads.
2. Retention Rate
For your app to truly be successful, people need to do more than just install it on their device. That’s why the retention rate is so important.
User retention tracks how many users come back to your app after their first session.
Studies show that 25% of mobile apps are used once and never opened again. So the steepest drop-off in user retention occurs in the first 48 hours.
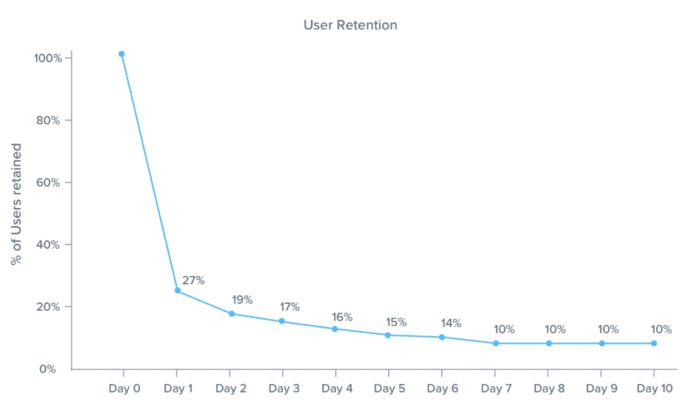
So it’s important for you to take steps during these key hours to ensure users have a pleasurable experience. Make sure you’re giving them a reason to open the app again and keep coming back for the long term.
It’s in your best interest to measure user retention over daily, weekly, and monthly segments. This can help you determine whether or not the metric is tied to specific known issues in the app, like crashes or downtime.
The key to success with high retention is optimizing the user experience. Having a great UX/UI design goes a long way to high retention.
3. Active Users
Active users take downloads and retention a step further. This key performance indicator measures how many people are actually using the app.
You can segment this metric into two main categories—daily active users and monthly active users. The daily active user count is a key sign of engagement. What’s causing people to come back and use your app every day?
Your monthly active user count is also an important metric. As people in this category could be opening your app several times per week—they’re just not opening it every day.
4. Mobile App Stickiness Ratio
Stickiness ratio is calculated by taking your daily active users and dividing it by the number of monthly active users.
This KPI represents your chances of getting an MAU to become a DAU.
Taking advantage of push notifications and updating your app on a regular basis are two ways to improve the stickiness of your app. You just need to come up with ways to encourage your existing users to open the app on a more frequent basis.
5. Session Length and App Session Intervals
Session length is a mobile app KPI that tracks how long app users engage with your app in a single session. App session intervals measure how frequently people return to your app.
Both of these are key signs of engagement. I like tracking these because they take your retention rate to another level. If your app has long session lengths and low session intervals, it tells you that people are using your app for a long time and re-opening it on a regular basis.
Research shows that mobile users spend 77% of time on their favorite three apps.
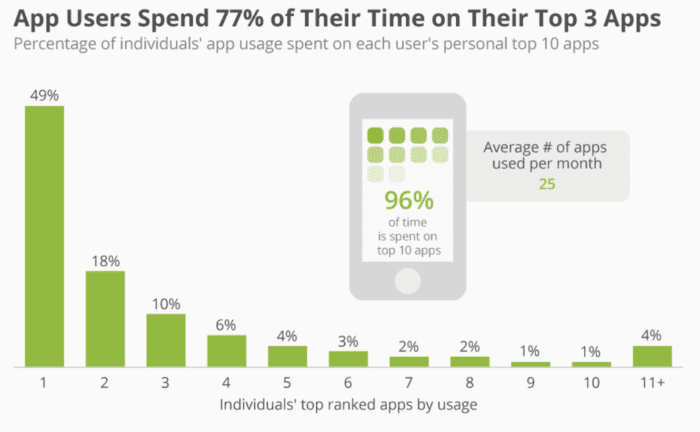
96% of app usage is spread amongst ten apps. So if you’re not in the top ten apps used on someone’s phone, you likely won’t have satisfactory session length or session interval metrics.
6. App Store Rating
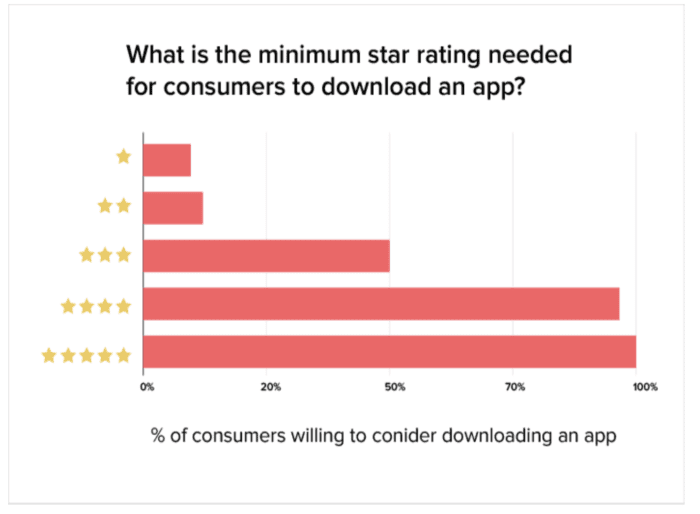
Your app store rating is a quick and easy way to see what existing users think about your app. When your rating is high, this metric can be a key part of your mobile app marketing strategy.
The reason why this metric is so important is because it can be directly tied to your app downloads. Most users won’t consider downloading an app if it doesn’t have a four or five-star rating.
One way to improve your rating is by giving existing users an incentive to rate your app. Most people won’t go out of their way to do this unless they had a really great experience or a really terrible experience—and the average user usually falls in between these two extremes.
7. In-App Purchases
An in-app purchase is pretty self-explanatory. It’s a metric that shows you how often users are spending real money in your app.
Obviously, you need to have purchases and app monetization enabled to track a metric like this. But it’s important to track this number over time to see if certain events or campaigns lead to more purchases.
For example, in-app purchases may increase for ecommerce apps during the holiday season. Or maybe you have a gaming app that saw an increase in purchases after a certain marketing promotion went live.
8. Mobile App Churn Rate
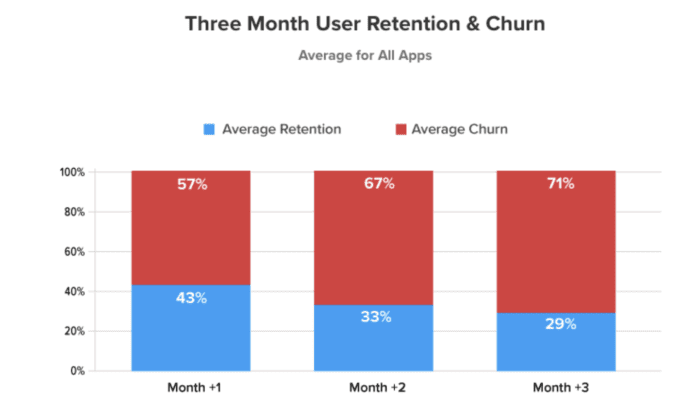
Churn rate is essentially the opposite of your retention rate. It tracks the percentage of people who stop using your app altogether.
Not all users who churn are created equally. If your low-value users stop using the app, it’s much worse than losing daily users who were highly engaged.
Studies show that the average churn rate is 57% in the first month. This number jumps to 71% by month three.
If high-value users are churning, it’s the sign of a much larger problem for your app that needs to be addressed immediately.
9. Mobile App NPS (Net Promoter Score)
Net promoter score is a mobile app KPI that’s often overlooked. It’s measured through surveys that ask users how likely they are to recommend your app.
Why is this so important? Research shows that people are four times more likely to download an app if they’ve been referred by a friend. Referred customers also have a 16% higher lifetime value than other users.
So a high NPS can ultimately impact other mobile app KPIs, and even help keep your marketing costs low.
10. App Store Ranking
Your app store ranking is your position on app stores for a given search term. The higher your ranking, the greater the chances that people will see your app and download it.
Knowing what to put on your app store page and understanding the principles behind app store optimization are some easy ways to climb the rankings.
Check out our complete guide to app store optimization (ASO) to learn more about this.
11. Abandonment Rates
Abandonment rate is often confused with retention rate and churn rate. But this mobile app KPI is a bit different.
This metric tracks how many users stop using your app before signing up. So someone went through the trouble of downloading your app and opened it but never completed the signup process.
High user abandonment is typically a sign of a poor onboarding process. Maybe you’re asking for too much information or not making it easy for users to sign up.
Syncing your app sign up with third-party logins like Facebook or Google is a great way to keep app abandonment low.
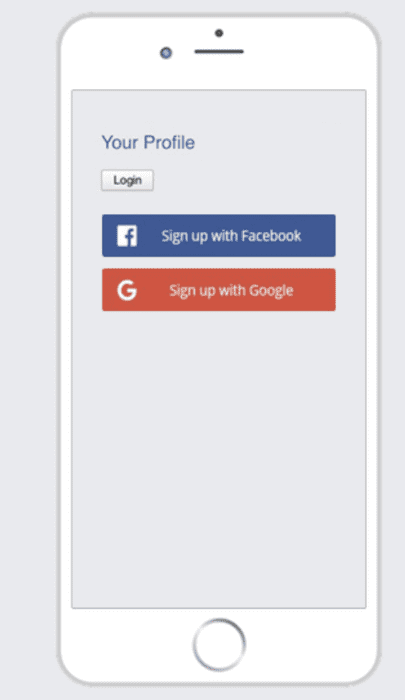
Then users can sign up using their existing account information instead of going through a long process to create a new one for your app.
12. Customer Acquisition Cost (CAC)
In an ideal world, your user acquisition cost will be as low as possible. This metric tracks the actual dollars it takes to get a single person to download your app.
This is also known as cost per install (CPI).
To calculate this metric, divide your ad spending over a specific period by the number of downloads in the same period. For example, let’s say you spend $2,000 on advertising in one month. This generated 1,400 installations. Your CPI would be $1.43.
13. Average Customer Support Response Times
How long does it take you to answer customer questions? This is a crucial app KPI for long-term customer satisfaction with your brand and app.
You should be tracking the time to first response as well as the total time to resolution.
Consider using a chatbot or something similar to generate an automated reply to customers until a real person can respond. This is one of the easiest ways to lower your time to first response time.
14. Average Revenue Per User (ARPU)
Now it’s time to talk about your revenue metrics. Most of you probably created an app with a plan to start generating revenue at some point or another. But sometimes, this gets lost in the shuffle when you’re tracking so many other KPIs.
Average revenue per user calculates how much revenue the average person generates in your app. To calculate ARPU, divide the total app revenue by your total number of app users.
If you don’t have a huge user base, make sure you look over the data to ensure that outliers aren’t skewing these metrics. In this case, a single user generating a ton of revenue could make your ARPU appear larger than it really is.
15. User Lifetime Value
Lifetime value (LTV) tracks how much you expect to make from a single user before that person stops using your app altogether. Here’s a simple formula for app user LTV:

One of the best ways to increase this metric is by extending the average customer lifetime. The longer someone uses your app, the greater chance you have of making more money from them in the long run.
Your marketing efforts will play a role in user lifetime value. You can’t stop engaging with users after they’ve downloaded the app. You need to drive engagement, release updates, provide excellent support, and ensure the overall user experience is satisfactory.
16. Average Order Value (AOV)
Average order value is another mobile app metric for those of you who are selling something, whether it be a product, service, or in-app upgrade.
It tracks how much users spend per purchase. Once you have this number figured out, then you can look for ways to increase your AOV. For example, an ecommerce shop might offer an upsell during the checkout process.
Another metric in this category to track is AOV per paying user. This KPI eliminates all users who don’t spend any money, so you can get a better understanding of how much money you’re getting from each transaction of paying customers.
17. Event Tracking
Event tracking is perfect for measuring user engagement metrics. You’ll want to look at specific actions within the app that are noteworthy and good for your bottom line.
Examples of events to track could include:
- Registration form completed
- Item added to cart
- Content shared with a friend
- Reaching a checkpoint in a game
- Purchases
Don’t just blindly pick and choose random events to track. You’ll want to look at specific events that make sense for your app’s performance or monetization strategy.
18. Average Screens Per Visit
This is another significant KPI for user engagement. Not every session is created equally.
Let’s say a user opens your app every day—you may think this is a great sign if you’re only tracking daily active users. But if they’re opening the app and not getting past the first screen, it’s a telling sign that there could be a problem with the UI and UX design of your app.
If your average screens per visit metrics are high, it shows that users are engaging with your app and going deep into its capabilities.
But this is also why it’s important to track app events (as mentioned above). Sometimes average screens could be misleading. Jumping from one screen to another could be an indication of design flaws, meaning the user can’t find what they’re looking for on the first try.
19. App Attribution
Attribution helps you monitor which sources sent users to your mobile app. Where exactly are they coming from?
This is crucial for marketing and sales purposes. You can determine if app users are coming from social media ads, PPC campaigns, organic search, your app landing page, and more.
As a result, you can use this metric to figure out which channels are driving the most downloads to your app.
20. Mobile App Speed
Speed is arguably the most important KPI for mobile app performance. If your app is too slow, it’s going to cause lots of problems that could lead to churn, abandonment, and hurt your retention rate.
Fast loading times can help you improve other app metrics. Just look at these numbers:
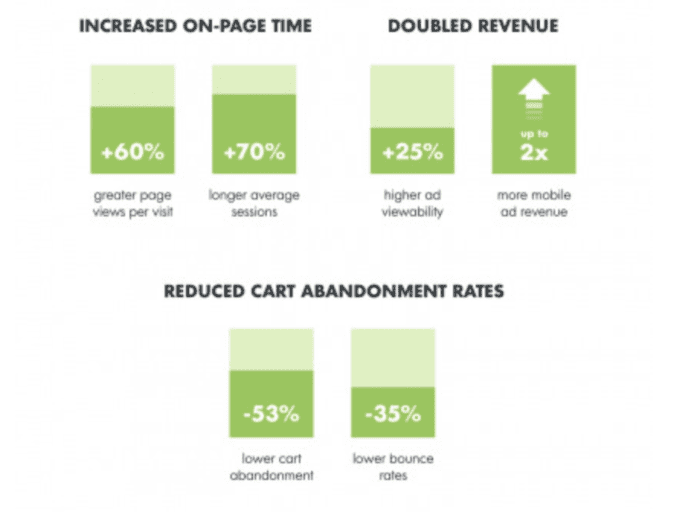
Speeding up your app increases the page views per visit and session duration while reducing bounces and cart abandonment. Each page should load in less than two seconds, but you should strive to do better than that. Keeping loading times under one second will help ensure users have a great experience.
21. Mobile App Latency
Like speed, latency falls into the app performance metrics category. While latency and speed are often used interchangeably, they’re actually two different KPIs.
Latency measures the time it takes to request and receive a response from your API. You want this number to be as low as possible.
For example, latency could impact how long it takes for a user to click a button. Whereas speed measures how long it takes for the page to load after the action has been made.
22. App Crashes and Bugs
Things like network crashes, bugs, downtime, and other mobile app performance APIs are important to keep an eye on.
Every app crashes and has bugs from time to time. It happens. But you obviously want to keep these instances to a minimum. Figure out what’s causing the problem, and fix them ASAP with patching or an update.
Just look at how your churn rates can be impacted by crashes:
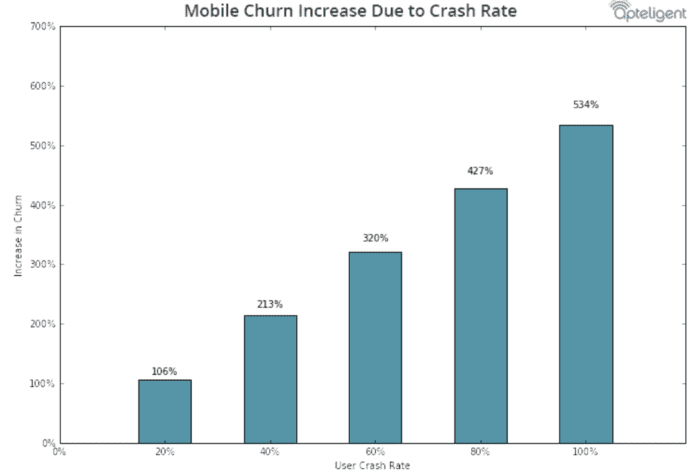
If you don’t measure mobile app performance, it could be a slippery slope that hurts other KPIs.
23. Funnel Tracking
Funnel tracking gives you an overview of the user journey. It shows you the sequence of events that a user took from the initial acquisition through the conversion.
For example, a user might enter your funnel when they download your app. From there, you can track their onboarding, free trial sign up, and eventually the path to a paid subscription or purchase.
Funnel tracking tells you where people are leaking from your funnel. This could be directly tied to your offer or maybe a user interface problem within the app.
If you find out that free trial users aren’t extending to a paid membership, you’d need to look for ways to plug the hole in that leak.
24. Organic Conversion Rate
This piggybacks off our attribution and funnel tracking. Conversions can be segmented into two main categories—paid and organic.
Paid conversions come from advertisements, whereas organic conversions come through organic search. The latter means that someone discovered your app without any influence from you or your ads. They simply searched for a need or want in the app store and chose your app from the list.
You want organic conversions to be successful, as they could help you lower your ad spending over time. If users are finding your app without you having to pay for campaigns, it’s great for your CPI rates as well.
25. Push Notification Metrics
Once users download your app, you’ll want to keep them engaged with push notifications. KPIs in this category include:
- View rate
- Open rate
- Opt-in rate
- Opt-out rate
- Re-engagement rate
- Conversion rate
If users are opting out of your push notifications, it could be a sign that you’re sending them too frequently. Or maybe the notifications you’re sending aren’t relevant to that user.
Push notifications can be crucial to your app’s success if you know how to use them properly. So it’s really important for you to keep a close eye on these.
Final Thoughts
These key performance indicators should keep you busy for the lifetime of your app. Don’t get overwhelmed here and feel like you need to start tracking everything overnight.
Start with what’s important to you the most. But eventually, you’ll want to incorporate all of these into your big-picture app strategy.
The great part about using a platform like BuildFire is that you’ll have built-in analytics from your admin dashboard. This makes it easier to track KPIs from a single source of truth.
Questions? Reach out to our team here at BuildFire, and we’d be happy to share some insights.